|
|
|
|||||||||
|
|||||||||
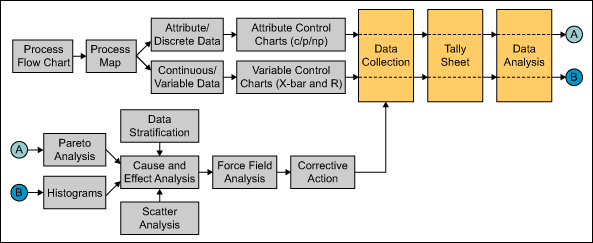
The concept of connectivity permeates processes – in any process the output of one tool/technique becomes the input to the next. Even at the conclusion of a process (whatever the process may be), its output becomes the input to the next process.
Even when the application of every tool in the connectivity chain perfectly completes its assigned task, it is necessary to turn over the results of the application to the next tool in the sequence to reach the ultimate goal, i.e., identification and selection of the optimal new or replacement methodology that smoothly functions in conjunction with the remainder of the unit.
Everything done on a regular basis is a process. A process is:
When observing a process flow chart or a process map, it is apparent that the output of a predecessor step becomes the input to successor steps. Practitioners of total quality management (TQM), Six Sigma and Kaizen (continuous improvement) know that this connectivity also exists among the 7-QC (seven quality control) tools. This inter-relationship for general improvement processes is shown in Figure 1.
| |||||
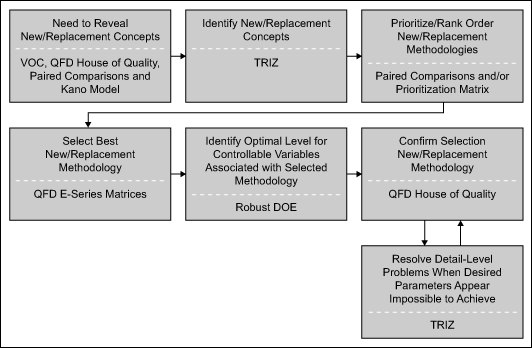
Connectivity also exists among the Theory of Inventive Problem Solving (TRIZ), 7-MP (seven management and planning) tools, VOC (voice of the customer), QFD (quality function deployment) and robust DOE (design of experiments). The inter-relationship among these principal tools of the product/service/system development process is shown in Figure 2.
| |||||
With the voice of the customer table (VOCT) used at the beginning of QFD, practitioners can listen to and observe the customer using a product or service. By going to the Gemba, a Japanese term meaning "the place where work is done," business practitioners can learn how a product or service is used and then apply their organizational capabilities to these products and services based on the spoken and unspoken needs of the customer.
| |||||
The VOCT gives an added edge to QFD users. It is a two-part tool providing structure and a process for seeking out items that the customer wants. It also reveals other items resulting in the early discovery of the customer's true needs. See Tables 1-3.
| Table 1: VOCT – Part I for a Flashlight | ||||||
| Voice of the Customer | Use | |||||
| Who | What | When | Where | Why | How | |
| Easy to Find During Night Time Power Failure | Adults, kids | See during power failure | Night | House, basement | See in dark, check circuit breakers or fuses | Hold in hand, set on surface |
| Table 2: VOCT – Part II for a Flashlight | |||||
| Reworded Demands | Demanded Quality | Quality Characteristics | Function | Reliability | Other |
| Can hold easily | Can hold easily | ||||
| Can use hands free | Can use hands free | ||||
| Maintain aiming | Maintain aiming | ||||
| Fits in drawer | Diameter | ||||
| Always ready to use | Does not work | ||||
| Table 3: Analyzing and Organizing Demands | |||||
| Reworded Demands | Demanded Quality | Quality Characteristics | Function | Reliability | Other |
| Can hold easily | Can hold easily | ||||
| Can use hands free | Can use hands free | ||||
| Maintain aiming | Can see easily | « « « « « « « « | « « « Maintain aiming | ||
| Fits in drawer | Can store easily | « « « « « « « Size | |||
| Always ready to use | Does not work | ||||
The paired comparisons technique is a step-by-step method for rank ordering a small list of items (usually no more than 10) in priority order. This fast and easy method helps teams prioritize their lists and make decisions by consensus. Ranking is a useful and important tool given the multiple ideas, opportunities and challenges prioritized from most to least desirable or costly.
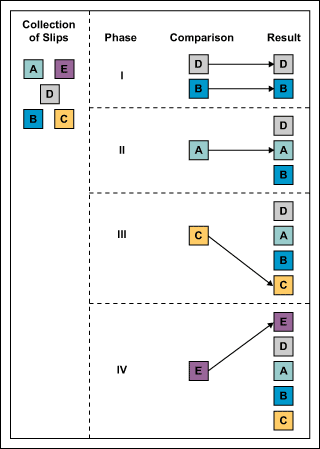
To begin, a team leader or a group facilitator prints the identity of each item on its own slip of paper – preferably paper with a light adhesive backing. Then all the paper slips are placed on a vertical surface such as a white board, window or wall where participants can easily view the ranking activity. The team leader/group facilitator starts the paired comparisons process by arbitrarily selecting two slips of paper and placing them adjacent to each other on the same vertical surface in proximity to the remaining slips.
The leader asks the team, "Which one of these two items is more (or less) important (or costly)?" Depending on the consensus, he places the slips one above the other with the better choice located above the lesser choice as shown in Figure 4.
| |||||
Next, arbitrarily select the fourth slip and repeat the placement process. When all slips in the original collection are ranked, the process is complete. The top slip is the most important/least costly/best choice. The bottom slip is the least important/most costly/worst choice.
The prioritization matrix uses a simple, two-dimensional matrix format. The row headings consist of the options being considered, and the column headings are the evaluation criteria. After identifying the pertinent criteria, the team then weights the criteria to indicate the importance relative to the other criteria.
The prioritization matrix is an innovation based on the results of combining two of the 7-MP tools – the tree diagram and the L-shaped matrix. To use the prioritization matrix, begin by selecting two sets of data that have been organized with a tree diagram. The outputs of the tree diagrams are used to develop both dimensions of the L-shaped matrix, which then becomes the prioritization matrix shown in Table 4.
| Table 4: Prioritization Matrix | ||||||
Options | Cost (0.26) | Time (0.14) | Resistance to Change (0.01) | Impact on Problem (0.59) | Row Total (1.000) | Rank Order |
A | (0.26) (0.31) = 0.081 | (0.14) (0.22) = 0.031 | (0.01) (0.11) = 0.001 | (0.59) (0.29) = 0.171 | 0.284 | 1 |
B | (0.26) (0.12) = 0.031 | (0.14) (0.23) = 0.032 | (0.01) (0.37) = 0.004 | (0.59) (0.19) = 0.112 | 0.179 | 3 |
C | (0.26) (0.12) = 0.031 | (0.14) (0.22) = 0.031 | (0.01) (0.02) = 0.000 | (0.59) (0.27) = 0.159 | 0.221 | 2 |
D | (0.26) (0.33) = 0.086 | (0.14) (0.19) = 0.027 | (0.01) (0.29) = 0.003 | (0.59) (0.04) = 0.024 | 0.140 | 5 |
E | (0.26) (0.12) = 0.030 | (0.14) (0.14) = 0.020 | (0.01) (0.21) = 0.002 | (0.59) (0.21) = 0.124 | 0.176 | 4 |
Grand Total | 1.000 | |||||
In business and industry, everyone has customers – internal customers, external customers and/or both. When determining what needs to be accomplished to satisfy or delight its customer, the tool of choice is QFD. QFD has many names – matrix product planning, decision matrices and customer-driven engineering are just a few examples. QFD is a focused methodology for listening to the VOC and effectively responding to those needs and expectations.
First developed in Japan in the late 1960s as a form of cause and effect analysis (one of the 7-QC tools noted earlier), QFD was brought to the U.S. in the early 1980s. It gained popularity as a result of numerous successes in the automotive industry. In QFD, quality is a measure of customer satisfaction with a product or a service. QFD is a structured method that uses the 7-MP tools to quickly and effectively identify and prioritize customers' expectations.
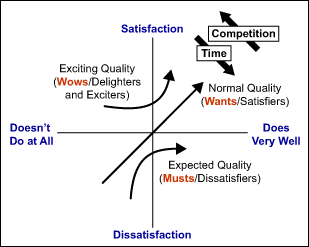
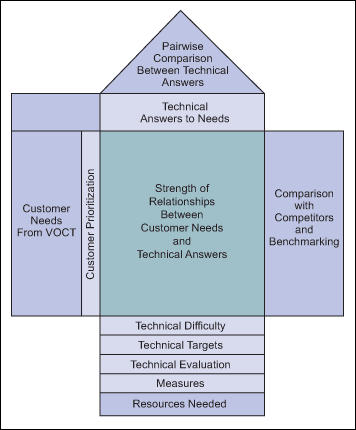
Beginning with the initial matrix, commonly termed the house of quality, the QFD methodology focuses on the most important product or service attributes or qualities. These are composed of customer wows, wants and musts from the Kano model of customer perception versus customer reality. Once prioritized, QFD deploys them to the appropriate organizational function for action. Thus, QFD is the deployment of customer-driven qualities to the responsible functions of an organization as seen in Figure 5.
| |||||
The roof of the HOQ, also known as the conflict matrix, provides an important capability in any search for new or replacement concepts. It identifies conflicts and potential interactions between the "hows." These conflicting hows can become controllable factors in the inner-outer array tableau of a robust DOE. If only an inner array is used, potential interactions between controllable variables can be tested for statistical strength and validity.
At the heart of the HOQ is the relationship matrix which identifies influential relationships between the whats and the hows. When these influential relationships are conflicting, they can also become controllable factors in the inner-outer array tableau of a robust DOE. Still in the relationship matrix, the presence of either an empty row (need to develop a means of satisfying customer needs) and/or an empty column (need to eliminate unnecessary activities) indicates an opportunity to apply TRIZ. There are other rooms in the HOQ that can benefit from the application of TRIZ.
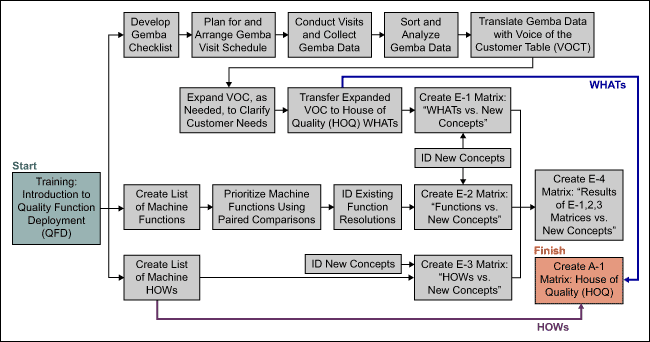
Figure 6 displays the complex interrelationships that exist between the VOC, the QFD-HOQ, the QFD whats and hows, and the QFD E-series matrices for new concept selection.
| |||||
Robust design of experiments (DOE) is an organized collection of tools and techniques used to create and evaluate efficient experimentation. DOE is applied to minimize the assets required to obtain a maximum quantity of much-needed data. The assets include cost, time and physical resources such as capital equipment, raw materials and test facilities.
Well-planned DOEs are carefully structured to obtain useful information most efficiently. DOE is directly applicable to a broad variety of business and industrial applications. The average businessperson can effectively apply DOE with two or three days of technical training. A designed experiment is a test or trial program that has been well structured to accurately measure the results (response or output variables) in comparison to the inputs (treatments, factors, or input variables). DOE is the most valuable single set of tools for the optimization and improvement of products, services and processes. Table 5 shows a typical designed experiment with three factors, three two-way interactions and one three-way interaction.
| Table 5: L8 Orthogonal Array | |||||||
Run No. \ Column | 1 | 2 | 3 | 4 | 5 | 6 | 7 |
1 | 1 | 1 | 1 | 1 | 1 | 1 | 1 |
2 | 1 | 1 | 1 | 2 | 2 | 2 | 2 |
3 | 1 | 2 | 2 | 1 | 1 | 2 | 2 |
4 | 1 | 2 | 2 | 2 | 2 | 1 | 1 |
5 | 2 | 1 | 2 | 1 | 2 | 1 | 2 |
6 | 2 | 1 | 2 | 2 | 1 | 2 | 1 |
7 | 2 | 2 | 1 | 1 | 2 | 2 | 1 |
8 | 2 | 2 | 1 | 2 | 1 | 1 | 2 |
Group | 1 | 2 | 2 | 3 | 3 | 3 | 3 |
When the planning team is assembled, brainstorm the factors that may be included in the experiment. These may be tabulated and then prioritized. A cause and effect diagram, also known as a fishbone or Ishikawa Diagram, is often used for brainstorming. This tool helps prompt the planning team regarding elements to be considered as experimental factors.
Robust DOE provides a systematic and efficient approach for finding a near-optimum combination of design parameters, producing a product that is functional, exhibits a high level of performance, and is insensitive or "robust" to noise factors. Noise factors are the set of variables or parameters in a process that are relatively uncontrollable, but can have a significant impact upon product quality and performance.
There are three primary advantages to a robust design.
In contrast, Taguchi's robust design method provides a design team with a systematic and efficient approach for conducting experimentation to determine near-optimum settings of design parameters for performance, development cycle time and cost. The robust design method uses orthogonal arrays (OA) to study the design parameter space, containing a large number of decision variables, which are evaluated in a small number of experiments. Based on design of experiments theory, Taguchi's orthogonal arrays provide a method for selecting an intelligent subset of the parameter space. Using orthogonal arrays significantly reduces the number of experimental configurations necessary to achieve optimality. Taguchi simplified the use of previously described orthogonal arrays in parametric studies by providing tabulated sets of standard orthogonal arrays and corresponding linear graphs to fit a specific project.
Just as every tool used by a carpenter is designed to assist in the achievement of a specific task, so too are all the tools and techniques described in the previous section. Referring back to Figure 2 the reader can see that by going to the Gemba and applying the VOC table, practitioners listen and learn from customers how products and services are actually used. Thus, the output from the VOC table becomes the input to the next tool, paired comparisons, where the musts, wants and wows (per the Kano Model) are rank ordered to identify the most important whats of the customers.
Next, it is necessary to apply TRIZ to identify new or replacement concepts that will meet the highly ranked customer whats. This is followed by the use of paired comparisons and/or prioritization matrix to prioritize, i.e., rank order, the new or replacement methodologies identified by the application of TRIZ. Then the QFD E-series matrices are employed to select the best new or replacement methodologies from the rank ordered list of methodologies developed. At this point robust DOE is introduced to the connectivity process to identify the optimal level/setting for each of the controllable variables associated with the top-ranked methodology.
Finally, the QFD house of quality is applied to confirm the selection of the top-ranked methodology. It may be necessary at this point, however, to re-introduce the use of TRIZ to resolve detail-level problems when it seems that the desired parameters of the top-ranked methodology appear impossible to achieve.
Even when the application of every tool in the connectivity chain perfectly completes its assigned task, it is necessary to turn over the results of the application to the next tool in the sequence to reach the ultimate goal – identification and selection of the optimal new or replacement methodology that smoothly functions in conjunction with the remainder of the unit.
It behooves interested practitioners to expand their individual and collective knowledge of the various tools and techniques that support TRIZ to insure that the application of TRIZ culminates in its maximum potential for innovation. Without the application of the connectivity chain of tools and techniques, the value of TRIZ is unnecessarily, artificially constrained.
Dr. Jack B ReVelle is a consulting statistician to manufacturing and service organizations throughout North America. Previously, he was the Director of the Center for Process Improvement for GenCorp Aerojet. Prior to this, he was the Leader of Continuous Improvement for Raytheon (formerly Hughes) Missile Systems Company in Tucson, AZ. He also established the Hughes team responsible for obtaining ISO 9001 registration in 1996. He is one of only two persons in the world who has been honored to receive both the Taguchi Recognition Award for his successful application of Robust Design and the Akao Prize for his outstanding contribution to the advancement of QFD. Dr. ReVelle received his B.S. in Chemical Engineering from Purdue University, and both his M.S. and Ph.D. in Industrial Engineering and Management from Oklahoma State University. Prior to receiving his Ph.D., he served 12 years in the U.S. Air Force. Contact Jack B. ReVelle at Cactus_Statman (at) yahoo.com.